
[latexpage]
Here is a short summary and explanation of the scores we used on VOD Clickstream.
Conventions
Before we delve into the details, here are some conventions.
- The clickstream refers to the clicks dataset
- By platform, we mean any VOD platform which hosts titles which can be movies, series or comedy specials.
- Each title has a unique identifier, $ID_{title}$.
- A “view” for a given platform ID $ID_{title}$ is a direct click to the media player in the platform with “duration” ≠0
- “duration” refers to the elapsed time between a “view” and any other click made by the same user directly after within the platform.
- Users are uniquely identified by an anonymous ID (which might reset after an unknown time of $O(months)$). Using that information pinpoints the same user within a window good enough to define “duration” in a useful way.
- To improve the quality of the data we use to calculate scores, we only include titles that were available in Netflix for at least four months.
- For titles tagged as movies by the platform, we include only those with a duration longer than 60 minutes.
- Unless otherwise stated, time units will be seconds.
Please note: The names of scores may be updated in the future. Current articles do not yet use all of the scores we have calculated and so as we come to incorporate more of them, we may find better names for them. In that event, we will update this page and note the new and old names.
The Scores
Scores are calculated for each country separately and come in two flavours, views and viewing time, which as the names suggest takes into account the number of clicks and the duration respectively. In other words, if a user clicks the link to the media player and watches “Eat, Pray, Love” for 1 hour, then goes back to the Platform homepage, we register 1 “view” and 1 hour “duration”.
To avoid over-counting duration in cases where users leave Platform without clicking anything (which can happen during any time in watching), we only add up durations that are shorter than the given title length + 10 minutes (though we count the corresponding view).
We keep views and viewing time separate mostly for convenience, as the number of views and the duration of such views, each come with unique insights which are easier to disentangle if we keep them as different categories.
By Country, Day by Day and from 0 to 1
As the click data, in general, does not come from the platform directly, we face the issue of accounting for an always-changing sample size which depends on the means by which the data was captured.
To mitigate this to some extent, we introduced an extra layer into our calculations. Scores are first calculated for each day and normalised (divided by) the total number of users for that day, in a given country. That means that we make here the strong assumption that our sample will always be large enough to be meaningful. While not perfect, this is much better than calculating global scores where the “captured number of users” fluctuates wildly.
Finally, scores for each country (after we sum over all days) are normalised so that they go from 0 (bad) to 1 (good). This is more of a convenience transformation for our analyses, in other words, it makes our life easier.
To summarise, scores can be about views or about viewing time, and they will be calculated for each country separately and summed day by day, taking into account the sample size (number of recorded clicks) and then normalised so that they go from 0 to 1.
The Base Score
As a starting point, let’s build a very simple score which we call the Base Score, $S_{base}$. The calculation is rather straightforward, and goes as follows:
$$ S^{views}_{norm}(ID_{title}) = \frac{\sum_{\mbox{days}}\frac{ \mbox{Total views for } ID_{title} \mbox{that day}}{\mbox{Total views for all IDs that day}}}{ \mbox{ availability window of } ID_{title} \mbox{ (days)}} $$ $$ S^{time}_{norm}(ID_{title}) = \frac{\sum_{\mbox{days}}\frac{\mbox{Total viewing time for } ID_{title} \mbox{that day}}{\mbox{Total views for all IDs that day}}}{\mbox{ availability window of } ID_{title} \mbox{ (days)} \times \mbox{ The length of } ID_{title}} $$
The base score is possibly the easiest, most meaningful thing we can calculate, but its simplicity comes with a price. For example, it does not take into account two very important things: The length of the title and how long it was available on the platform.
We can easily improve on this though, as with some work we can find that information and include it in the scores. Below we explain how we do it.
The availability window
Shows can be available in the platform from weeks to years. While the true availability window is usually not public information, we can get our own estimation by looking at the first and last time anyone watched a given title in our data.
When including the availability window in the scores, if we are not careful, we might end up punishing/favouring titles that have been available for a long/short time.
In our preliminary explorations, we rediscovered something we already know: Very often, titles get the bulk of their views at the beginning of their tenure on the platform. This means we have to be careful.
For example, a show that has been available for four years would have collected many more views/viewing time than a show that has been available for six months. On the other hand, if we just divide the scores by the availability window, we are assuming shows get a constant stream of views. As this is not the case, we would wrongly punish the show which had been available for longer.
So for some of our scores, we do include the availability window but we adjust it by capping it at eight months. In our analysis of the clickstream data, we found that this choice largely factors out any bias towards titles that have been available for a long time, but also avoids over-adjusting and punishing them instead.
In the following, when we say availability window, we mean the capped version.
The Better Scores: “Popularity Scores”
We finally get to what we think is a good compromise between ease of calculation and a meaningful metric for success in the VOD platform.
These scores try to mitigate the imperfection of our source data while also being excellent tools in our analysis. In broad terms, they are performance indicators for a given title in a VOD platform that factor out aspects such as the duration of the title, how long the title was available or the fluctuations of both the daily source data and the number of subscribers in each country. One score focuses on the number of views for the title, while the other takes into account what fraction of the title was actually watched by the users.
In less broad terms, following the conventions at the beginning of this article, each score is calculated as follows
$$ S^{views}_{norm}(ID_{title}) = \frac{\sum_{\mbox{days}}\frac{ \mbox{Total views for } ID_{title} \mbox{that day}}{\mbox{Total views for all IDs that day}}}{ \mbox{ availability window of } ID_{title} \mbox{ (days)}} $$ $$ S^{time}_{norm}(ID_{title}) = \frac{\sum_{\mbox{days}}\frac{\mbox{Total viewing time for } ID_{title} \mbox{that day}}{\mbox{Total views for all IDs that day}}}{\mbox{ availability window of } ID_{title} \mbox{ (days)} \times \mbox{ The length of } ID_{title}} $$
In order to bring the Popularity Scores into alignment with media industry scoring conventions, they are presented in articles as numbers between 0 and 100, derived by simply multiplying our internal score by 100.
Bonus: Extra scores
It is very difficult, perhaps impossible and potentially ill-advised to make a unique metric that encompasses the richness of the clickstream dataset. In our explorations and analysis, we constructed other metrics and scores that we find useful and currently use and will use in our articles. They pinpoint a particular aspect and are built less as an overall metric of success and more as a window to a certain quality or feature we want to explore. Below we dive into two such scores.
Viewer Scores
We can try to capture not only the number of views and viewing time, but also how important a given title is for the user watching it. Our approach to look at this is simple but we think it is very powerful. Most of the score is calculated in the same way as the scores above, but this time we do it first for each user, summing all contributions at the end. This allows us to factor in the relative importance the title has for the user, by including the total views for each user in the platform. Put simply, if a user logs into the platform to watch only one title, their views will count much more to raise the score than the views from another user that watches many titles.
$$ S^{views}_{viewer}(ID_{title}) = \sum_{\mbox{days}} \sum_{\mbox{ all users}} \frac{ \mbox{Total views of } ID_{title} \mbox{ by this user, that day}}{\mbox{Total views by this user (all IDs)} \times \mbox{Total views for all IDs that day}} $$ $$ S^{time}_{viewer}(ID_{title}) = \sum_{\mbox{days}}\sum_{\mbox{ all users}} \frac{\mbox{Total viewing time of } ID_{title} \mbox{ by this user, that day} }{ \mbox{ The length of } ID_{title} \times \mbox{Total views by this user (all IDs)} \times \mbox{Total views for all IDs that day}} $$
These scores are of course most relevant when thinking about TV shows. In that case, the scores for each episode are summed together to make a “show score”.
Freshness score
The Freshness score captures to what extent a title keeps bringing new views during its availability window. To do this, we came up with a rather straightforward and quick procedure to estimate the shortest time window containing 60% of the total views, within a given title’s availability window.
Put simply, if a title collects views at a constant rate of say, 10 views a day during the whole tenure in the VOD platform, it will have a perfect freshness score. On the other hand, a title that has 99% of its views in its first quarter of its tenure in the VOD will have a terrible freshness score.
Note here that this is independent of whether the show got many views or little views.
To ease the presentation of how this score is calculated, below there is a quick flowchart of the algorithm:
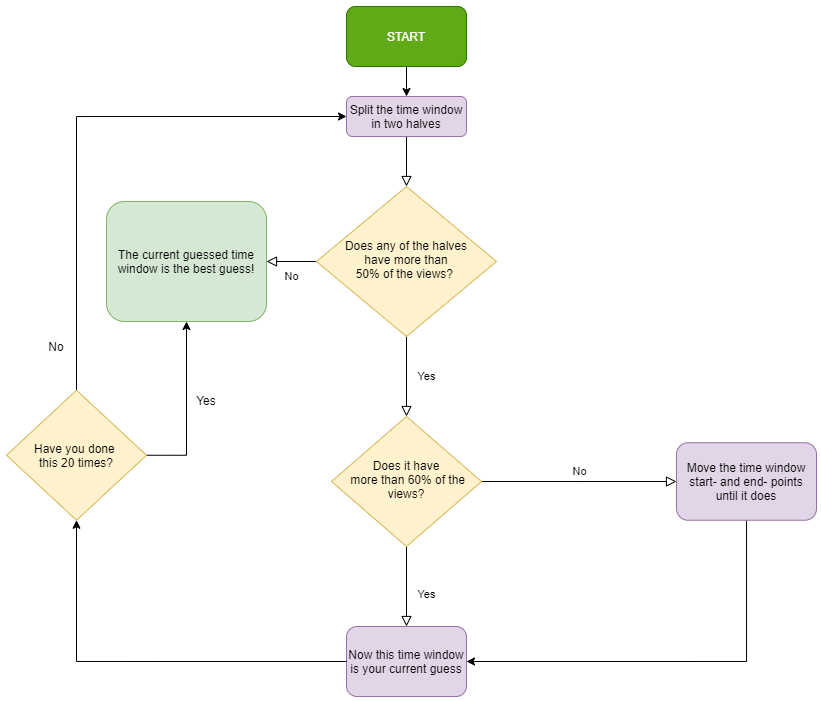
Following the procedure above, for each $ID_{title}$ we get the best guess for the time window containing 60% of the views, $L_{60}$. The Freshness score is then
$$ Freshness(ID_{title}) = \frac{L_{60}}{\mbox{The length of } ID_{title}}$$
The freshness score should be a complement to other analyses, it is after all just as an estimation of the dynamics of viewership. For example, there is no clear recipe for comparing the relative success of a title with very low freshness (bulk of its views in a very short time) but that brought many new users to the platform and titles that keep accruing views during their Platform tenure.
Bingeness score
When it comes to TV shows, besides views and viewing time, how likely a title is to bring binge watching sessions is an important aspect of a title’s success.
We look at this in a very simple way. Let’s say a viewer watches one episode of a TV show. We ask the following question: Was the previous title they watched the previous episode in that show’s season?
If the answer is “yes”, then both views become “binge views”. At the end, we can tally up binge watches for a given episode (or show) during their tenure on the VOD platform. We divide that by the total views for all other TV shows and there you go! we have a simple measure of the “bingeness”. As with the other scores we do this day by day, country by country.
Written as a formula, the bingeness score is then simply:
$$ S^{Binge}( ID_{title}) = \frac{ \mbox{ Total number of binge views of } ID_{title} \mbox{ that day}}{ \mbox{Total views for all IDs that day} } $$
While bingeness is by no means the only indicator of a title’s success, it can help us understand a little better the multidimensional problem of what it means to be successful in VOD.
All scores are tools for us to understand, process and analyse our massive dataset. They are not the sole drivers of our analyses, but our guiding principle in the search for patterns, insights and the directions that point us towards specific things to dive into.